Offense Is Up Across All of Baseball, and the Number Proving It Isn’t Close
Individual hot streaks are easy to spot and easy to write about. A player who homers twice in a game or strings together a ten-game tear generates an obvious, self-evident story that requires little digging to notice. League-wide shifts in how the game is being played are a different kind of story entirely, harder to see from inside the experience of watching any single game, and easy to miss entirely unless someone is actually keeping count across the full league rather than following one team or one player at a time. This season, the count is worth paying close attention to, because the number it produces is not subtle once it’s actually assembled.
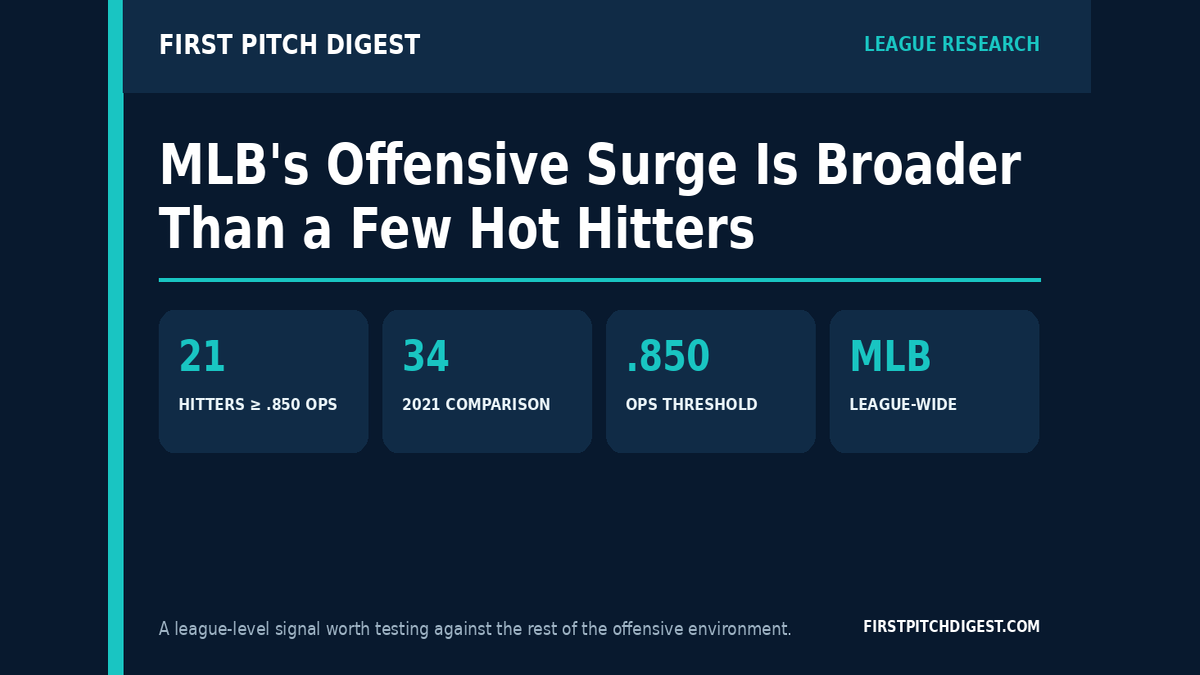
Entering play on August 6, 21 qualified hitters across Major League Baseball had posted an OPS of .850 or higher for the season. That’s the most players to clear that threshold in a single season since 2021, when 34 players reached the mark, itself widely regarded as a modern high point for offensive production across the league following a period of significant rule and ball changes.
Why a single combined statistic is the right tool here
OPS combines on-base percentage and slugging percentage into a single figure, which makes it a reasonably efficient proxy for overall offensive quality without needing to separately track batting average, walk rate, and power output as three disconnected numbers. Counting how many hitters clear a high bar in that single combined number, rather than looking only at league-wide batting averages or home run totals in isolation, captures something that simple league averages tend to obscure: whether strong offensive performance this season is broadly distributed across a meaningful number of hitters, or concentrated narrowly in just a handful of standout individual seasons pulling up an otherwise unremarkable league average.
A league average can rise modestly even while the actual distribution of talent stays roughly the same as prior seasons, if a small number of elite hitters are having career years while the rest of the league performs at roughly typical levels. Counting the number of hitters who individually clear a demanding threshold sidesteps that ambiguity. Twenty-one separate hitters reaching an .850 OPS is a statement about breadth, not just about a handful of exceptional individual performances happening to coincide in the same year.
Why twenty-one is a meaningfully large number, not just a bigger one
A handful of standout offensive seasons happen in most years almost as a matter of course, the ordinary variance of a large league producing several hitters who put together career-best campaigns in any given season regardless of broader environmental conditions. Twenty-one hitters clearing an .850 OPS threshold in the same season is a different order of magnitude from that ordinary baseline, one that suggests something structural about the current offensive environment rather than simply a cluster of individually excellent players having good years that happened to line up by coincidence.
What that structural something actually is remains an open and genuinely interesting question, one this piece isn’t in a position to answer definitively without deeper investigation into pitch-level data across the league. It could relate to the specifications of the baseball itself, which has been the subject of periodic scrutiny and adjustment across recent seasons. It could relate to pitching depth being stretched thinner across expanded rosters and bullpen usage patterns that ask more relief pitchers to cover more innings than in past eras. It could relate to hitting approach changes spreading league-wide as more organizations adopt similar swing philosophies and launch-angle-conscious training methods across their player development systems. Most likely, it’s some combination of several of these factors working together rather than any single explanation carrying the full weight on its own.
Comparing this season to 2021 more carefully
The 2021 season, which produced 34 hitters clearing this same threshold, arrived amid a specific and well-documented set of circumstances, including scrutiny over baseball specifications that led to real, acknowledged changes in subsequent seasons. That context matters for how this year’s number should be read. If 21 hitters are clearing an .850 OPS this season without the same specific baseball-related factors that were widely discussed as contributing to the 2021 spike, that would suggest a different, and in some ways more durable, set of underlying causes, since it wouldn’t be explained away by a single, already-addressed equipment variable the way some of the 2021 conversation eventually was.
That’s a meaningful distinction for anyone trying to project whether this represents a temporary spike likely to recede in coming seasons or a more lasting shift in the league’s offensive environment. A spike explained primarily by a specific, correctable equipment factor tends to recede once that factor is addressed. A spike explained by broader structural trends in pitching depth, roster construction, or hitting approach tends to persist and even compound over subsequent seasons, since those underlying factors don’t reverse themselves as easily or as quickly as a specification change to a single piece of equipment can.
What this means for how individual seasons should be read
There’s a practical implication buried in this league-wide number that connects directly back to how any single hitter’s season should be evaluated this year. A hitter posting a strong OPS in a season where 21 other hitters are also clearing a high bar is operating in a genuinely more competitive offensive environment than a hitter posting the identical number in a season where only a handful of others reach that same level. That context doesn’t diminish any individual hitter’s specific accomplishment, but it does mean cross-season comparisons of raw offensive statistics require some caution, since the same OPS figure can represent meaningfully different levels of relative dominance depending on how the broader league environment happened to be performing in that particular year.
The pitching side of the same coin
Any conversation about a league-wide offensive surge is incomplete without acknowledging that it necessarily represents the flip side of a pitching story happening at the same time. Twenty-one hitters posting elite offensive numbers doesn’t happen in a vacuum. It happens against a backdrop of pitching performances that, in aggregate across the league, are allowing that level of production to occur. That could mean pitching depth genuinely is thinner than in past eras, with more innings falling to less experienced or less effective arms as bullpens expand and starters are asked to throw fewer innings per outing on average. It could also mean something more specific about how hitters as a group have adjusted to the pitching approaches that were dominant a few seasons ago, closing gaps that pitching staffs had successfully exploited in the recent past.
Either explanation, or some blend of both, points toward the same broader conclusion: a league-wide offensive number this large isn’t simply a hitting story. It’s a story about the competitive balance between hitting and pitching shifting somewhat toward hitters this season, relative to where that balance has sat in recent years, and that kind of shift tends to be exactly the sort of trend that front offices and player development departments across the league spend the following offseason trying to understand and respond to.
Why this number matters beyond this single season
League-wide offensive trends like this one tend to influence roster construction decisions well beyond the season in which they’re first observed. If pitching-needy front offices conclude that the league has genuinely entered a higher-offense environment, that can shift how they value pitching depth relative to hitting depth in trades, free agency, and player development priorities heading into the following offseason. A number like 21 qualified hitters clearing an .850 OPS isn’t just a snapshot of one season’s statistics. It’s the kind of data point that can quietly influence roster-building decisions across the league for multiple years afterward, once teams have had enough time to study it and draw their own conclusions about what’s driving it.
Worth watching
Whether this number holds steady or continues growing as the season moves toward its final two months, when fatigue typically affects offensive production league-wide and the sample becomes large enough to represent a fuller and more reliable picture of the season’s true offensive environment. It’s also a genuinely useful number to revisit at the season’s actual conclusion, for a proper direct comparison against 2021 and other recent high-offense seasons once the complete year’s sample is finalized, rather than drawing firm conclusions from a snapshot taken with two months of the schedule still remaining to be played.