Burke’s July Was Built on 45 Strikeouts and Four Walks
Earned run average is the number that gets printed in the headline, the one that ends up in the highlight graphic and the one casual fans use to size up how a pitcher’s month went at a glance. It’s also, despite its prominence, not always the number that explains the most about what actually happened on the mound. Defense behind a pitcher, ballpark dimensions, and the sequencing of hits and outs across an inning can all shape a final ERA in ways that have little to do with a pitcher’s own stuff or command. For White Sox starter Burke’s July, the ERA was genuinely excellent. But the number buried underneath it, one that strips away most of that outside noise, is the one that actually deserves the headline.
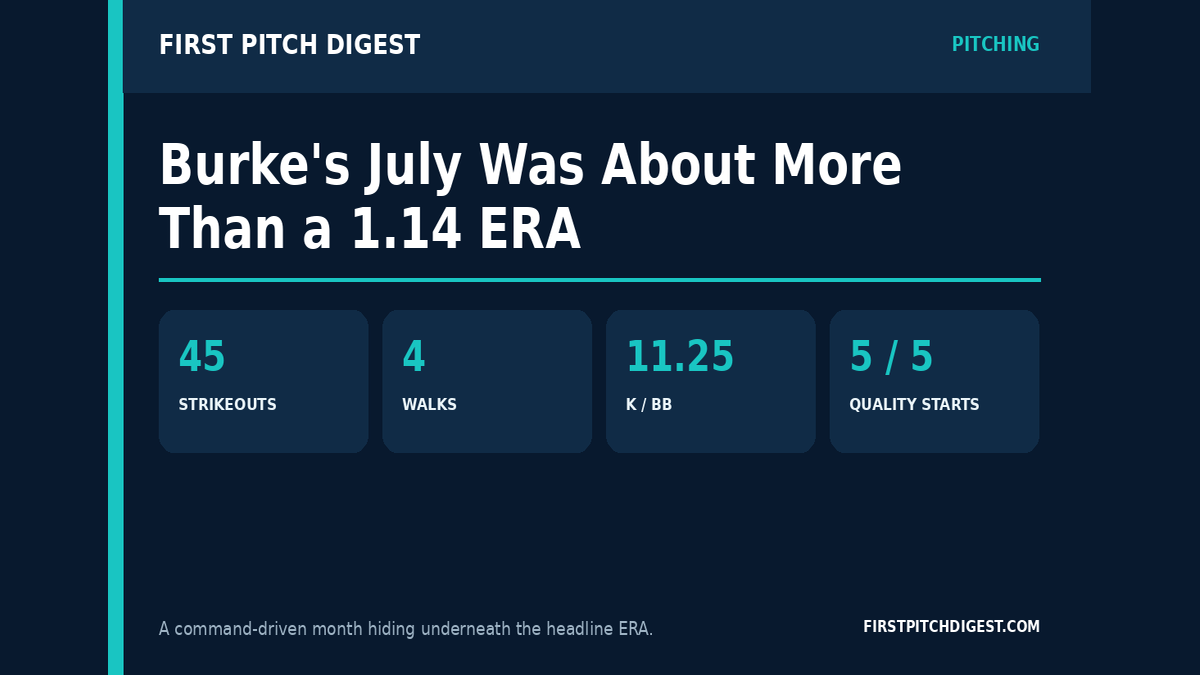
Across July, Burke posted a 1.14 ERA over 31 and two-thirds innings, allowing just 20 hits along the way. Underneath that ERA sits the number that matters more for understanding what actually drove the month: 45 strikeouts against only 4 walks. He went five for five in quality starts across the month, striking out 10 batters in three of those outings and 9 in another.
Why strikeout-to-walk ratio is the cleaner signal
ERA can be shaped by factors well outside a pitcher’s direct control. A great defensive play behind him turns a would-be hit into an out. A cluster of soft, well-placed singles in one particular inning inflates a line that reflects bad luck as much as bad pitching. Ballpark dimensions and even the specific umpire calling balls and strikes on a given night can all nudge a final ERA up or down in ways that have nothing to do with the quality of a pitcher’s actual stuff that day.
Strikeout-to-walk ratio strips almost all of that variability away. A strikeout requires a pitcher to get a swing and miss or a called third strike, an outcome that depends almost entirely on the pitcher’s own stuff and location rather than on what the defense behind him does after contact. A walk requires the opposite, a pitcher losing the zone and giving away a free baserunner regardless of how well or poorly the opposing hitter actually swung the bat. Together, the ratio between the two measures how often a pitcher is getting outs on his own terms versus how often he’s handing out free baserunners through his own lack of command. It’s a number that belongs almost entirely to the pitcher, largely insulated from the defense, ballpark, and luck that can distort ERA on any given night.
A ratio above 11 strikeouts for every walk across a full calendar month, the level Burke produced in July, is the kind of number that shows up rarely even among established front-line starters with years of major league track record behind them. Finding it from a pitcher who isn’t yet a household name is the specific detail that makes this worth a closer look rather than a passing mention buried in a monthly stat roundup.
What five quality starts in five tries actually represents
Going five for five in quality starts across a calendar month is a form of consistency that’s arguably as impressive as any single dominant outing within that stretch. A pitcher can produce one or two brilliant starts in a month while still having an off night or two mixed in in between, a common pattern even among genuinely good starting pitchers across a full season. Producing a quality start in every single turn through the rotation for an entire month means there was no off night, no outing where fatigue, a mechanical hiccup, or simply a tough opposing lineup got the better of him. That kind of floor, as much as the ceiling represented by the strikeout numbers, is often what separates a pitcher a team can build a rotation around from one who’s merely capable of occasional brilliance.
The specific breakdown, 10 strikeouts in three of the five starts and 9 in the fourth, adds another layer to the consistency argument. This wasn’t one dominant strikeout outing dragging up an otherwise middling monthly average. Four of the five starts individually cleared a strikeout total that most pitchers would be thrilled to post even once in a given month, suggesting the swing-and-miss stuff was showing up as a repeatable trait across the month rather than a one-time peak.
The team record as external validation
The White Sox went 4-1 in Burke’s five July starts, a record that lines up with what the underlying peripheral statistics suggest rather than existing in tension with them. It’s a useful check on the analysis. Sometimes a pitcher’s advanced statistics look outstanding on paper while the team’s actual win-loss record in his starts tells a more complicated story, perhaps because of a lack of offensive support or bullpen trouble undoing strong starts after the fact. When a pitcher’s K/BB ratio, ERA, and his team’s record in his starts all point in the same direction, as they do here, it’s a stronger overall signal than any single number would be in isolation, since it suggests the whole picture is coherent rather than one strong data point standing alone against a murkier broader context.
Why extreme ratios like this one tend not to hold indefinitely
The honest caveat worth stating clearly is that a K/BB ratio this extreme, sustained across an entire calendar month, is unusual even for the best command pitchers in the sport, and history suggests some regression toward a still-excellent but less extreme number is the more likely outcome over a larger sample. Command this precise, walking only 4 batters across nearly 32 innings, requires a level of consistency in release point and pitch execution that’s difficult to sustain indefinitely across a full season’s worth of starts, simply because fatigue, minor mechanical drift, and the ordinary variance of live pitching tend to erode even elite command over time.
That’s not a prediction that Burke’s performance will fall off a cliff. Plenty of pitchers who post standout months like this settle into a still-strong, if less extreme, level of performance for the rest of the season rather than reverting all the way back to league average. But treating a ratio this far outside normal ranges as the new permanent baseline, without acknowledging that some regression is the statistically expected outcome, would be the kind of overclaiming this publication tries specifically to avoid.
Why this kind of month tends to get missed
There’s a broader pattern worth naming here, one that extends beyond this single pitcher. Command-driven months like this one tend to receive less attention than power-driven months featuring gaudy strikeout totals racked up through pure velocity, even when the command-driven version represents the harder and rarer skill. A pitcher who strikes out fourteen batters in a single dominant start generates highlight packages and immediate attention. A pitcher who quietly avoids walks across five consecutive starts, building the kind of ratio Burke produced in July, generates a stat line that requires someone to actually go looking for it before its significance becomes clear.
That’s partly a function of how the sport is covered day to day. Live broadcasts and daily recaps are built around single-game moments, a strikeout, a home run, a diving catch, rather than around trends that only become visible once a full month of outings is compiled and viewed together. A statistic like a monthly K/BB ratio simply doesn’t exist as a single dramatic moment that a broadcast can capture and replay. It exists only in the aggregate, which means it depends on exactly the kind of after-the-fact compiling this piece is doing to become visible at all.
What separates command from stuff, and why both matter differently
It’s worth being precise about the distinction being drawn here, since strikeouts and walks are sometimes discussed as though they measure the same underlying thing. Strikeout totals, on their own, are primarily a measure of stuff, the raw quality of a pitcher’s pitches, velocity, movement, and how difficult they are for a hitter to square up even when the location is imperfect. Walk totals are primarily a measure of command, a pitcher’s ability to consistently locate his pitches where he intends to, independent of how nasty the pitch itself is. A pitcher can have outstanding stuff and still walk plenty of hitters if his command lags behind his raw pitch quality. Burke’s July suggests both are working in tandem right now, which is a different and generally more sustainable foundation than swing-and-miss stuff without the command to consistently locate it.
Worth watching
Whether this ratio holds as a larger sample builds across August and September, or whether July represented a genuine peak within an already strong season rather than the new normal going forward. A K/BB ratio this extreme over a full calendar month is unusual enough that some regression toward something still very good, but less historically rare, would be the expected pattern based on how command trends have played out for comparable pitchers in past seasons. The more interesting question by season’s end may not be whether July repeats exactly, but how much of this month’s command Burke manages to carry forward into the stretch run.